Additional Experimental Results

Anonymous supplementary material for peer review, ICLR 2027 Submission 22855.

Contents
  1. Capacity shift in learned m-curves: B/16 vs. H/16
  2. Learned m-curves beyond the first 30 directions
  3. Interactive: dial the MFlow gains
  4. ConvRefiner: radial power spectrum at 512px
  5. Interactive: ConvRefiner before / after comparison

§1Capacity shift in learned m-curves: B/16 vs. H/16#

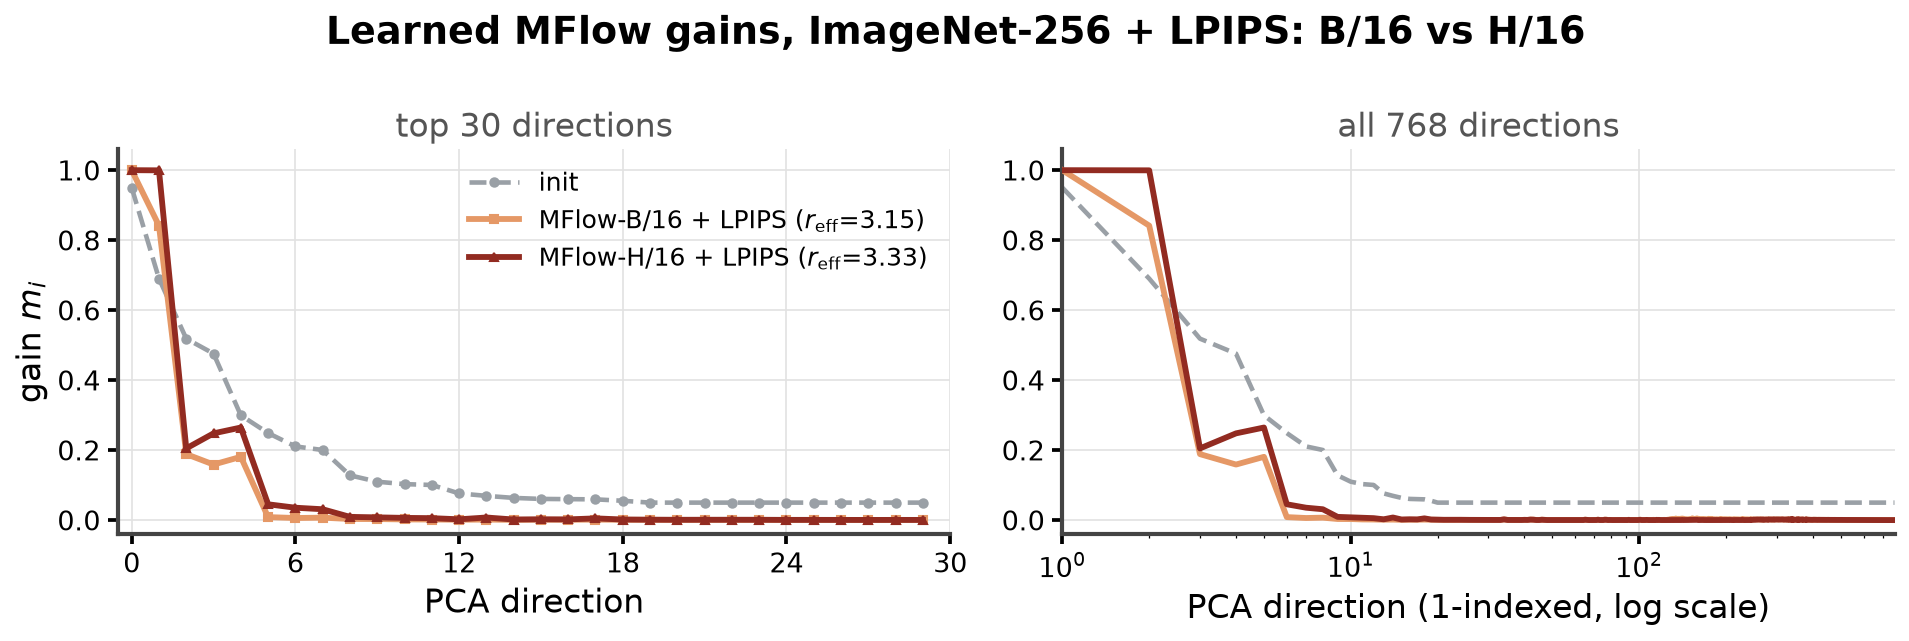
Learned MFlow gains $m_i$ for B/16 vs. H/16, same recipe (ImageNet-256 + LPIPS). The larger model keeps slightly more velocity-like gain: $r_{\text{eff}}$ 3.15 → 3.33.

Learned MFlow gains for B/16 vs H/16 on ImageNet-256 with LPIPS: top 30 directions and all 768 directions
Fig. 1. MFlow-B/16 ($r_{\text{eff}}=3.15$) vs. MFlow-H/16 ($r_{\text{eff}}=3.33$). Only capacity differs.

§2Learned m-curves beyond the first 30 directions#

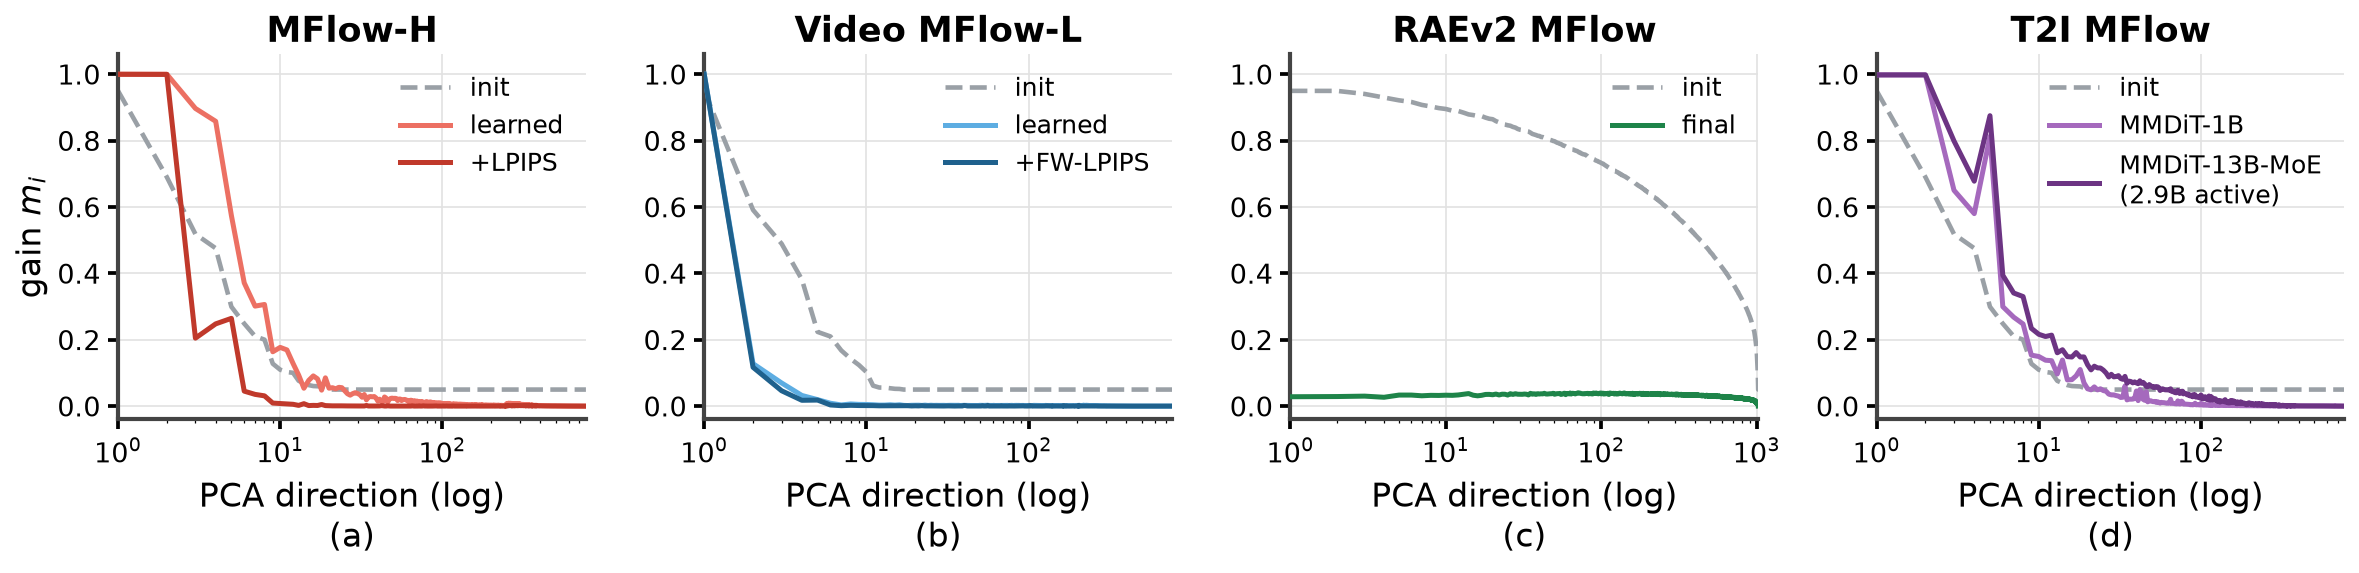
The paper plots the first 30 directions. Here are all 768 (1024 for RAEv2). Beyond the head the gains are flat at zero, except RAEv2 where they are near zero everywhere.
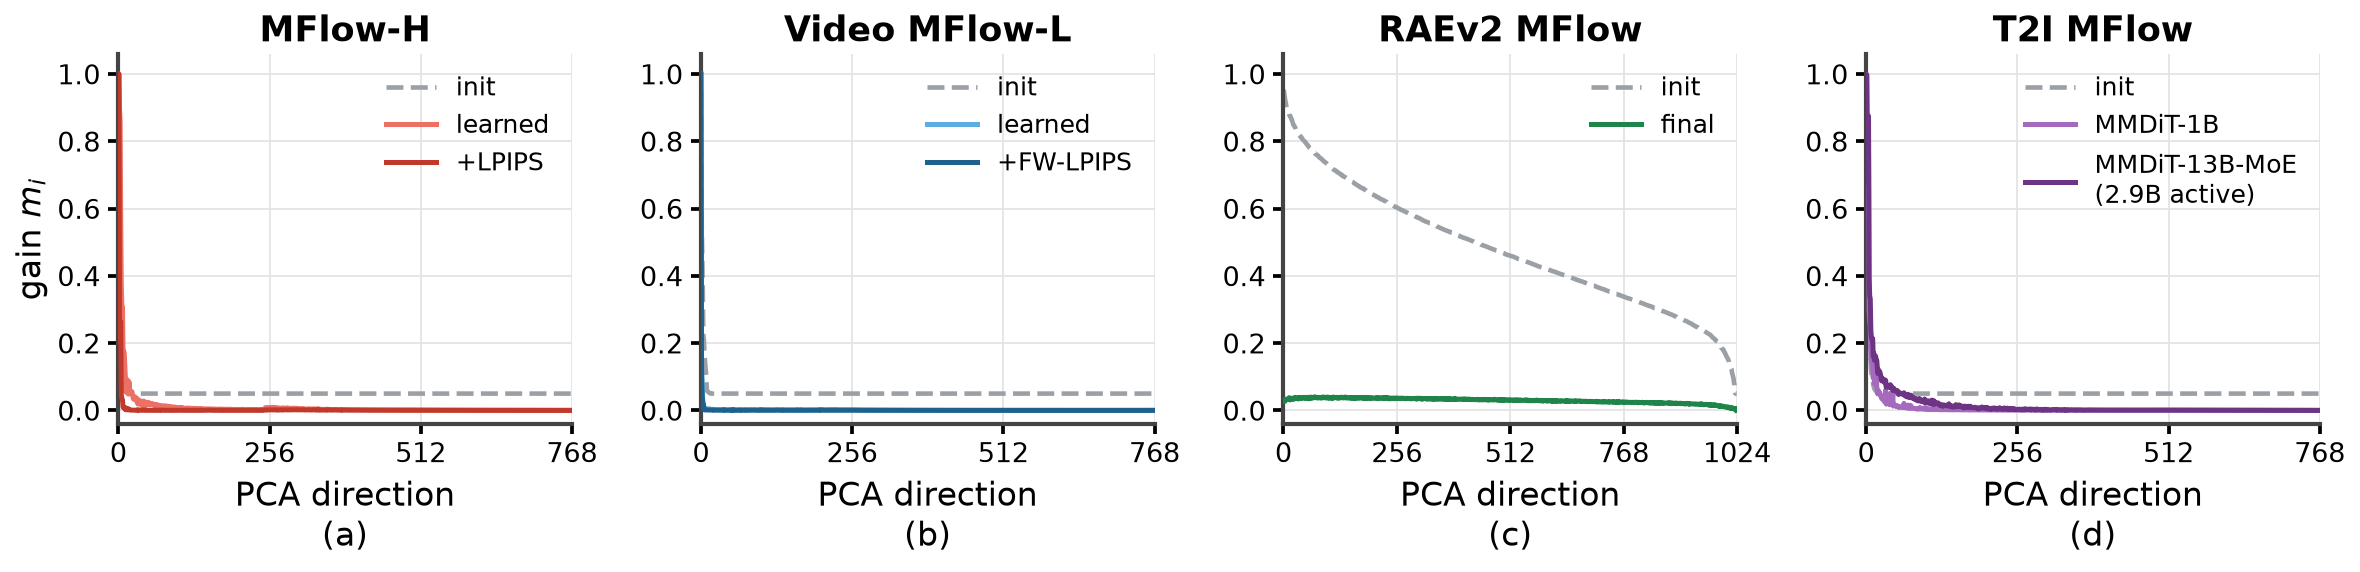
Learned MFlow gains over all PCA directions (linear axis) for MFlow-H, Video MFlow-L, RAEv2 MFlow and T2I MFlow
Fig. 2a. All directions, linear axis.
Learned MFlow gains over all PCA directions (log axis) for the same four models
Fig. 2b. Same curves, log axis.

§3Interactive: dial the MFlow gains#

Interactive version of Fig. 2 from the paper for better understanding. Pick a preset or drag the gains $m_i$ and watch the target $u_G = x_0 - M\epsilon$ change. The MFlow preset is the learned MFlow-H/16 + LPIPS curve.

Loading interactive demo…

§4ConvRefiner: radial power spectrum at 512px#

512px text-to-image, MFlow-XXL/16. Without the refiner the spectrum falls −2.53 dB below real images in the 0.5–0.7 band. With it every band is within 1 dB.
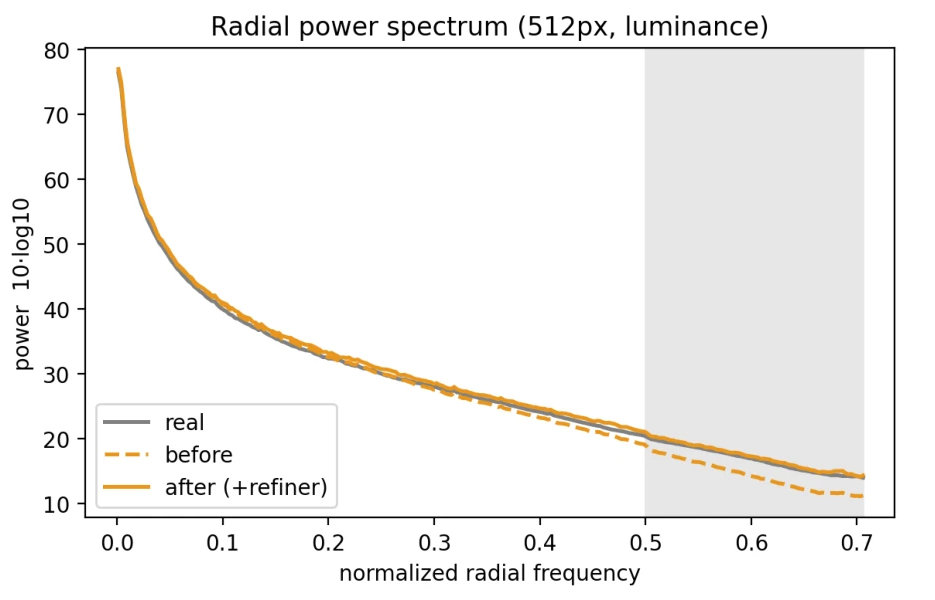
Radial power spectrum at 512px: real, before and after ConvRefiner
Fig. 3. Radial power spectrum (luminance) of real images vs. MFlow-XXL/16 samples before and after ConvRefiner. Shaded: 0.5–0.7 band.
Band (normalized radial frequency)w/o ConvRefinerw/ ConvRefinerChange
low (< 0.125)+0.71+0.87+0.16
mid (0.125–0.25)+0.27+0.84+0.57
high (0.25–0.5)−0.70+0.62+1.33
> 0.5 (shaded band)−2.53+0.39+2.91

Table 1. Mean deviation from the real-image spectrum per band (dB). Positive means more power than real images.
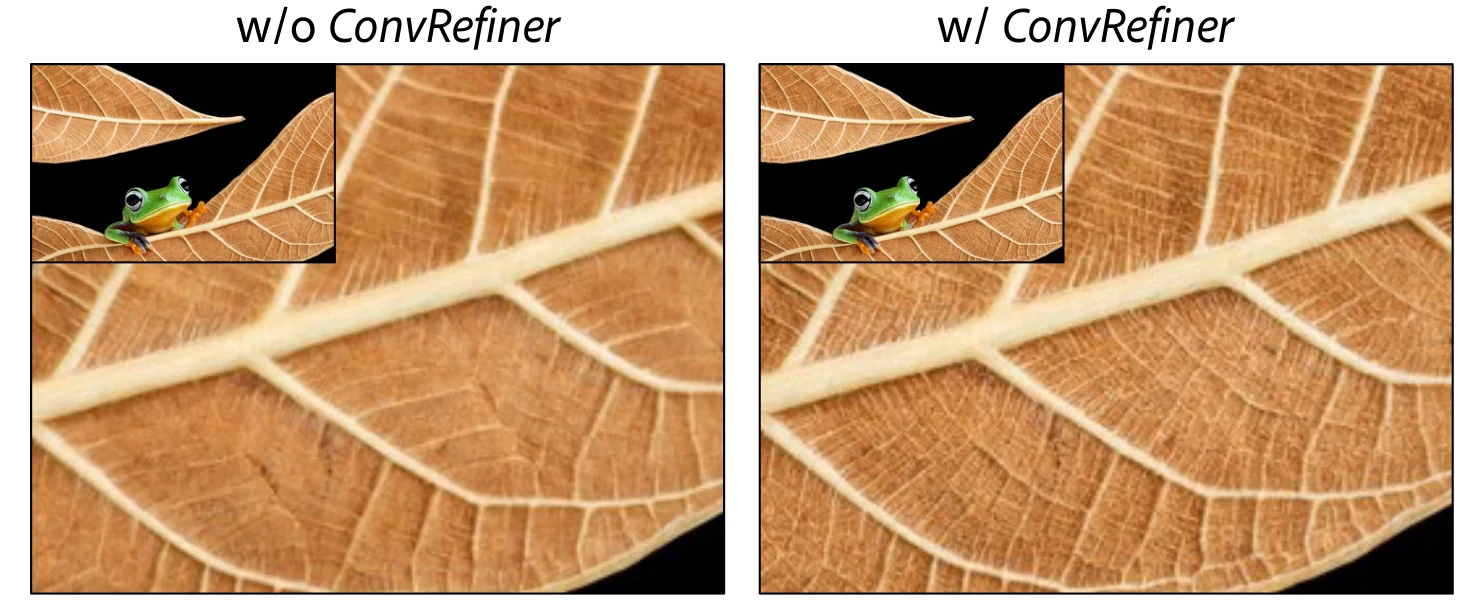
512px text-to-image crop without and with ConvRefiner
Fig. 4. 512px sample without (left) and with (right) ConvRefiner, zoomed on the leaf texture.

§5Interactive: ConvRefiner before / after comparison#

MFlow-XXL/16 text-to-image, without / with ConvRefiner. Click or drag to move the divider. The panes show the same region at 2×.

With ConvRefiner Without ConvRefiner Without ConvRefiner With ConvRefiner
↔
Without
With